
Linear Regression: Predicting Trends with Simplicity
With simplicity and precision, linear regression unveils the hidden secrets in the relationships between variables.

Linear regression, one of the most classic statistical tools, is widely used and often the first algorithm explored by those interested in data science.
Its popularity is due to its simplicity, interpretability, and flexibility, making it a solid choice for both initial analyses and practical applications in fields like economics, social sciences, biology, and others.
Despite its simplicity, linear regression plays a fundamental role in data analysis.
It allows us to identify, quantify, and explore relationships between variables, helping to answer important questions such as: is there a significant relationship between these variables? How does one variable change in relation to the other?
You can find the code on Colab at: https://exploringartificialintelligence.substack.com/p/notebooks
What is Linear Regression?
In its simplest form, linear regression seeks to model the relationship between two variables by fitting a linear equation that best describes the data. This equation is expressed as:
y = a + bx, where:
x is the explanatory or independent variable,
y is the dependent variable,
a is the intercept (the value of y when x = 0),
b is the slope coefficient (indicating how y changes in relation to x).

Objective of Linear Regression
The main goal is to measure the strength and direction of the relationship between variables. This relationship is typically represented by the correlation coefficient, which ranges from -1 to 1:
-1 to 0: Negative correlation (as x increases, y tends to decrease).
0: No correlation (the variables are independent).
0 to 1: Positive correlation (as x increases, y tends to increase as well).
Practical Applications and Predictions
Linear regression is not limited to correlation analysis. It is also a powerful predictive tool. After identifying the relationship between x and y, we can estimate future values of y based on new values of x.
Practical Example
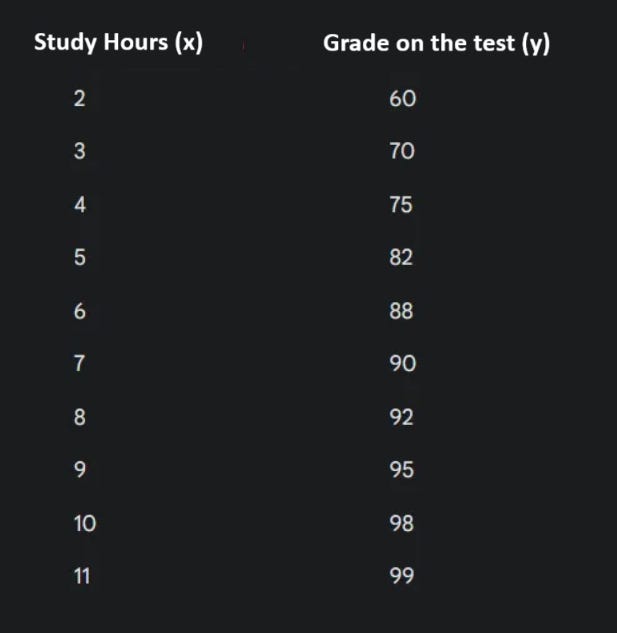
In this practical example, we will explore the application of simple linear regression to analyze the relationship between the number of study hours and test scores. The goal is to build a model that allows us to predict student performance based on their study time.
x (number of study hours) is the independent variable.
y (test score) is the dependent variable.
Let’s assume we’ve collected data from 10 students:
We will use a linear regression algorithm to find the values of b0 (intercept) and b1 (slope) for the regression line. The equation of the line will be of the form:
Test Score (y) = b0 + b1 * Study Hours (x)
The linear regression algorithm will calculate the optimal values of b0 and b1 that minimize the sum of squared differences between actual test scores and the predicted scores by the regression line.
After training the model, we will have the numerical values for b0 and b1. For example:
Let’s say, after applying the algorithm, we obtained b0 = 55 and b1 = 4. The regression line equation would be:
Test Score (y) = 55 + 4 * Study Hours (x)
Interpretation:
b0 (Intercept): The value of 55 indicates the predicted score for a student who did not study at all. Note that this value may not make sense in the real world and serves only as the starting point for the line.
b1 (Slope): The value of 4 indicates that for each additional hour of study, the test score increases by 4 points.
Predictions:
With the regression line equation, we can make predictions for any number of study hours. For example:
If a student studied 7 hours, the predicted score is: y = 55 + 4 * 7 = 83
If a student studied 12 hours, the predicted score is: y = 55 + 4 * 12 = 103 (In this case, we would need to assess the plausibility of the prediction since it exceeds the maximum possible score).
Let’s code it!
import numpy as np
from sklearn.linear_model import LinearRegression
import matplotlib.pyplot as plt

# Example data (the table with study hours and test scores)
study_hours = np.array([2, 3, 4, 5, 6, 7, 8, 9, 10, 11]).reshape(-1, 1)
test_scores = np.array([60, 70, 75, 82, 88, 90, 92, 95, 98, 99])

# 1. Create the linear regression model
model = LinearRegression()

# 2. Train the model with the data
model.fit(study_hours, test_scores)

# 3. Get the coefficients (b0 and b1)
b0 = model.intercept_
b1 = model.coef_[0]

print(f"Intercept (b0): {b0:.2f}")
print(f"Slope (b1): {b1:.2f}")

# 4. Make a prediction for 7 hours of study
test_hours = np.array([[7]])
predicted_score = model.predict(test_hours)[0]
print(f"Predicted score for 7 hours: {predicted_score:.2f}")

# 5. Visualize the results (Data and Regression Line)
plt.scatter(study_hours, test_scores, color='blue', label='Training Data')
plt.plot(study_hours, model.predict(study_hours), color='red', label='Regression Line')
plt.scatter(test_hours, predicted_score, color='green', marker='x', s=100, label='Prediction')
plt.xlabel('Study Hours')
plt.ylabel('Test Score')
plt.title('Linear Regression - Study Hours vs. Test Score')
plt.legend()
plt.grid(True)
plt.show()
Results:
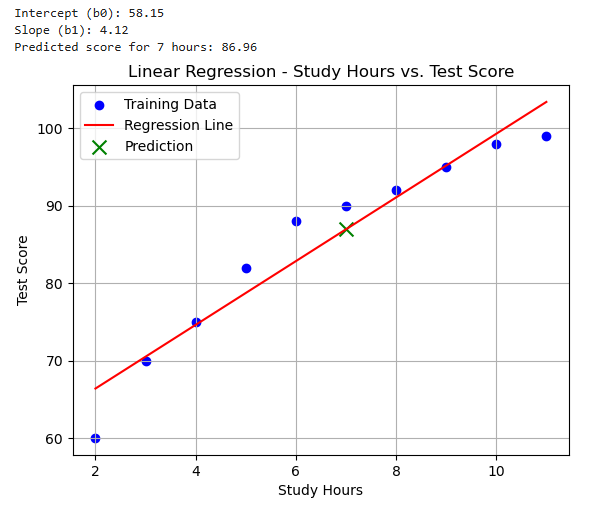
This example illustrates how simple linear regression helps model and predict relationships between two variables, providing a practical tool for data analysis.
You can find the code on Colab at: https://exploringartificialintelligence.substack.com/p/notebooks
Multiple Linear Regression
Multiple Linear Regression is an extension of simple linear regression. By including multiple independent variables, we can model scenarios where more than one factor influences the outcome. For example, predicting the price of a property based on characteristics such as area, location, and number of rooms.
Conclusion
Linear regression is an essential tool for anyone who wants to understand patterns in data and make data-driven predictions.
Its simplicity hides a surprising potential, often serving as the starting point for more advanced techniques in statistics and machine learning.
Now that we understand the fundamentals of linear regression, let's explore logistic regression and its practical applications.
Stay tuned!! 💗