
K-Means: Grouping Data Efficiently
Grouping data has never been easier – discover the power of K-Means


Continuing with the "Top 8 Machine Learning Algorithms: Everything You Need to Know" series, it's time to get to know K-means!
K-means is one of the most popular machine learning algorithms for clustering, which is the process of grouping data.
Simple and efficient, it is widely used in various fields such as data analysis, customer segmentation, image compression, and much more.
You can find the code on Colab at: https://exploringartificialintelligence.substack.com/p/notebooks
What is K-Means?
K-means is an unsupervised learning algorithm that organizes data into K groups. It works by distributing points into clusters, minimizing the distance between the points of the cluster and its centroid.
To better understand how K-means works, it’s important to understand what unsupervised learning is.
Unsupervised Learning
In unsupervised learning, the model is trained without the presence of labels or known answers. Instead of trying to predict a specific value, the goal is to identify patterns or structures in the data. The algorithm tries to find clusters or associations in the data autonomously, without the need for external information.
That's why K-means is considered an unsupervised learning algorithm: it organizes data into clusters (groups) based on their similarities, without the user needing to provide labels for the data.
How It Works
The K-means process can be broken down into four main steps:
Define the number of clusters (K).
Initialize the centroids randomly.
Assign each point to the closest cluster.
Update the centroids and repeat until convergence.
This process continues until the centroids no longer change significantly.
Advantages
Easy to implement and fast for moderate datasets.
Works well with well-separated data.
Good scalability for large data volumes.
Disadvantages
The number of clusters must be predefined.
Sensitive to initial values (can get stuck in local minima).
May not work well with non-spherical shaped clusters.
Let’s Code!
Now that we’ve seen what K-means is and how it works, let’s dive in!
We will use a sample dataset with 30 examples, where we have simple characteristics of dogs and cats: size (in cm) and weight (in kg). The goal is for K-means to group the data into two classes: dogs and cats.
Python Code to Create the Dataset and Apply K-Means:
import numpy as np
import pandas as pd
import matplotlib.pyplot as plt
from sklearn.cluster import KMeans
# Creating a simple dataset with 30 examples
# Size (cm), Weight (kg)
data = np.array([
[40, 10], [35, 8], [45, 12], [50, 15], [60, 20], # Dogs
[38, 9], [55, 18], [42, 11], [52, 14], [48, 13],
[60, 25], [38, 7], [37, 6], [65, 28], [47, 12],
[30, 5], [32, 4], [34, 6], [36, 5], [33, 6], # Cats
[25, 3], [28, 4], [29, 3.5], [27, 4], [26, 3],
[30, 4.2], [31, 4], [35, 6], [33, 5], [32, 4.5]
])
# Creating the DataFrame
df = pd.DataFrame(data, columns=['Size (cm)', 'Weight (kg)'])
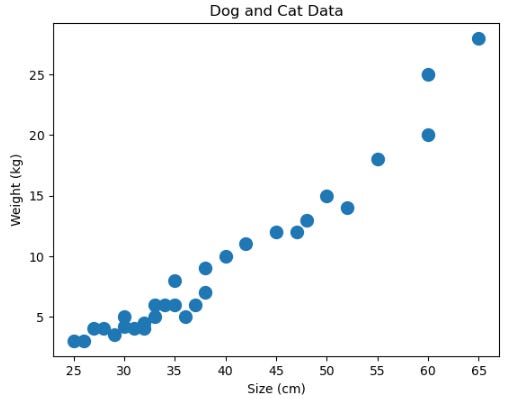
# Visualizing the dataset
plt.scatter(df['Size (cm)'], df['Weight (kg)'], s=100, cmap='viridis')
plt.title("Dog and Cat Data")
plt.xlabel('Size (cm)')
plt.ylabel('Weight (kg)')
plt.show()
# Applying K-Means with 2 clusters (dogs and cats)
kmeans = KMeans(n_clusters=2, random_state=42)
kmeans.fit(data)
# Assigning clusters to the data
df['Cluster'] = kmeans.labels_
# Plotting the results
plt.scatter(df['Size (cm)'], df['Weight (kg)'], c=df['Cluster'], s=100, cmap='viridis')
plt.scatter(kmeans.cluster_centers_[:, 0], kmeans.cluster_centers_[:, 1], s=200, c='red', marker='X') # Centroids
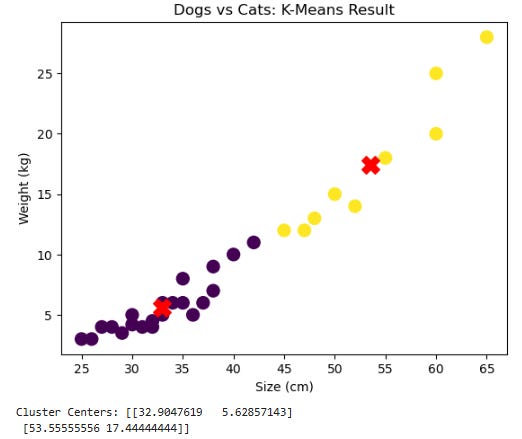
plt.title("Dogs vs Cats: K-Means Result")
plt.xlabel('Size (cm)')
plt.ylabel('Weight (kg)')
plt.show()
# Displaying the cluster centers
print("Cluster Centers:", kmeans.cluster_centers_)Result
Plotting the dataset in a graph:
K-Means Result:
Explanation
Size (cm) and Weight (kg) were the two features created for the dog and cat examples
Dogs tend to be larger and heavier, while cats are generally smaller and lighter
The K-Means algorithm was set to create 2 clusters (one for dogs and the other for cats)
The graph shows how K-Means groups the data, with the centroids of the clusters marked in red.
Inference
To make an inference on a new instance, we can use the following code:
Keep reading with a 7-day free trial
Subscribe to Exploring Artificial Intelligence to keep reading this post and get 7 days of free access to the full post archives.